
What you'll find in this section
Data about
- Population trends
- Population breakdowns by race, ethnicity, age, and gender
- Household types
- Foreign-born residents
Key Findings
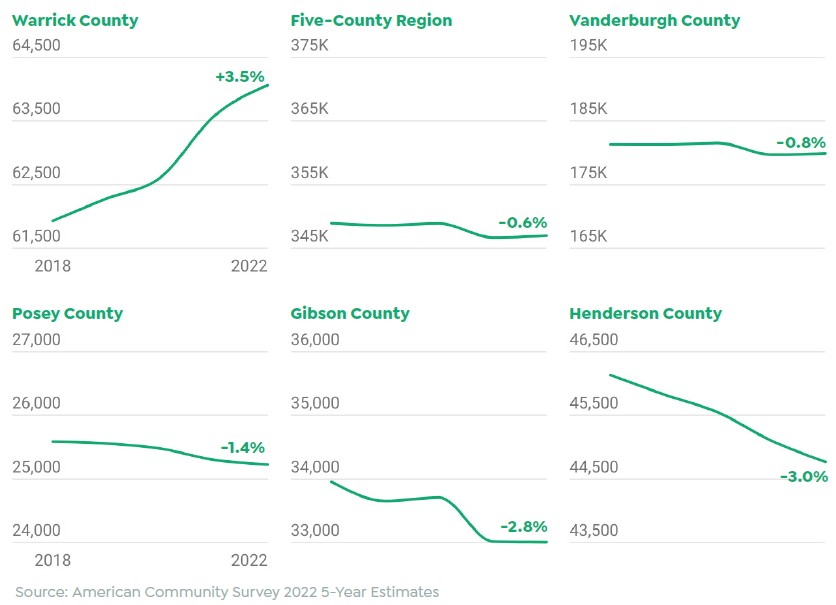
- The population of the Greater Evansville Region was relatively static, declining by 0.6% in the last five years.
- Population declined 0.8% in Vanderburgh County, 3.0% in Henderson County, and 2.8% in Gibson County. Warrick County actually grew by 3.5%, outpacing the state’s growth rate.
- Just over half of men and women in the region are married. Men are more likely than women to not have married (32% vs. 22%). Women are more likely to outlive their spouse—9% of women are widows.
- Most households are married, but in Vanderburgh County, one third of men and women are unmarried.
Where you live matters
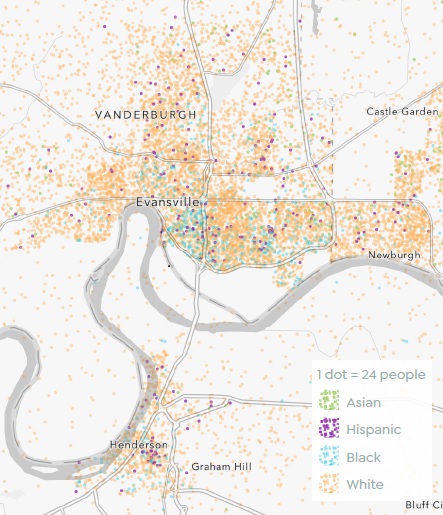
The Greater Evansville Region is diverse, and this map shows where different races and ethnicities are more populous. We focus on central Evansville where diversity is highest to provide a more clear map.
Currently, 347,00 people live in the Greater Evansville Region (five counties including Gibson, Henderson, Posey, Vanderburgh, and Warrick). Since 2018, the total population has decreased by 2,000, a 0.6% decrease in five years. This runs counter to Indiana’s 2% growth during this period. Like many other U.S. regions, this negative population trend can be explained by socio-economic conditions, aging population, outmigration of young population, shifting demography, deaths from COVID-19, and lack of economic and employment opportunities.1 2
For example, historically, the Greater Evansville Region is known for its strong manufacturing base in automobile production, molded plastics, and nutritional products. Many opportunities have been replaced with outsourced labor or automation in recent decades. Although this transition creates some opportunities for a smaller portion of blue-collar jobs, many residents leave the region to seek employment opportunities.
Although the population of the Greater Evansville Region has decreased by 0.6% in the last five years, we observed some variation among the five counties. Henderson County lost its population at the fastest rate (3.0%), and Gibson County lost 2.8% of its population. Warrick County grew by 3.5%, outpacing the state’s growth rate.
Four out five counties lost population since 2018
Annual population estimates by area, ordered by five-year population change
Population Estimates by Age Groups
Overall, middle-aged adults (age 35-64) are the largest group (38%) of the Greater Evansville Region’s total population, followed by youth under age 19 (25%). Young adults (age 20-34) make up 19% of the population, and seniors (age 65+) make up 18%.
An age pyramid (right) is a helpful way to visualize how birth and death rates will impact future population growth. The region’s age pyramid’s shape is considered “stationary”—an equal number of people in most cohorts indicates low birth rates and static population growth.
The comparison of 10-year age groups revealed some interesting patterns in the Evansville region. For all the age groups between 0 and 50, there are more men than women. However, as they age, the female population surpasses the male population in all other age groups. The difference is highest for the population aged 80 and above, with 9,062 women and 5,431 men.
Evansville’s regional “age pyramid” is stationary, meaning birth and death rates are about equal and population growth is stagnant.
Five-county population totals by age and gender
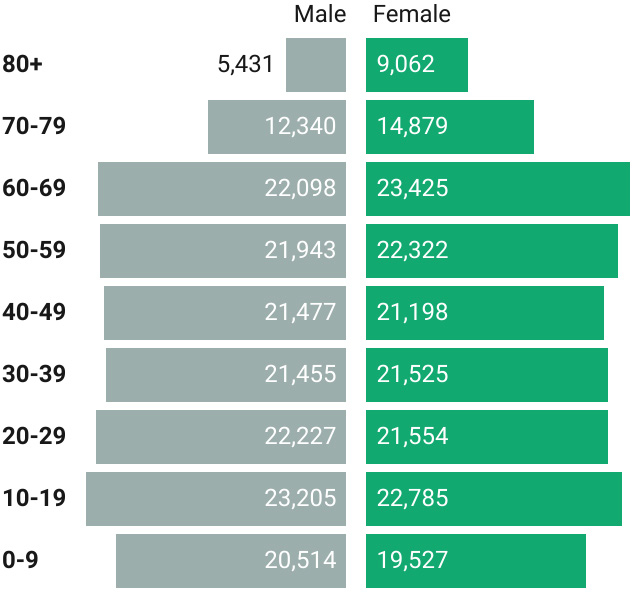
Source: American Community Survey 2022 5-Year Estimates
Senior Populations
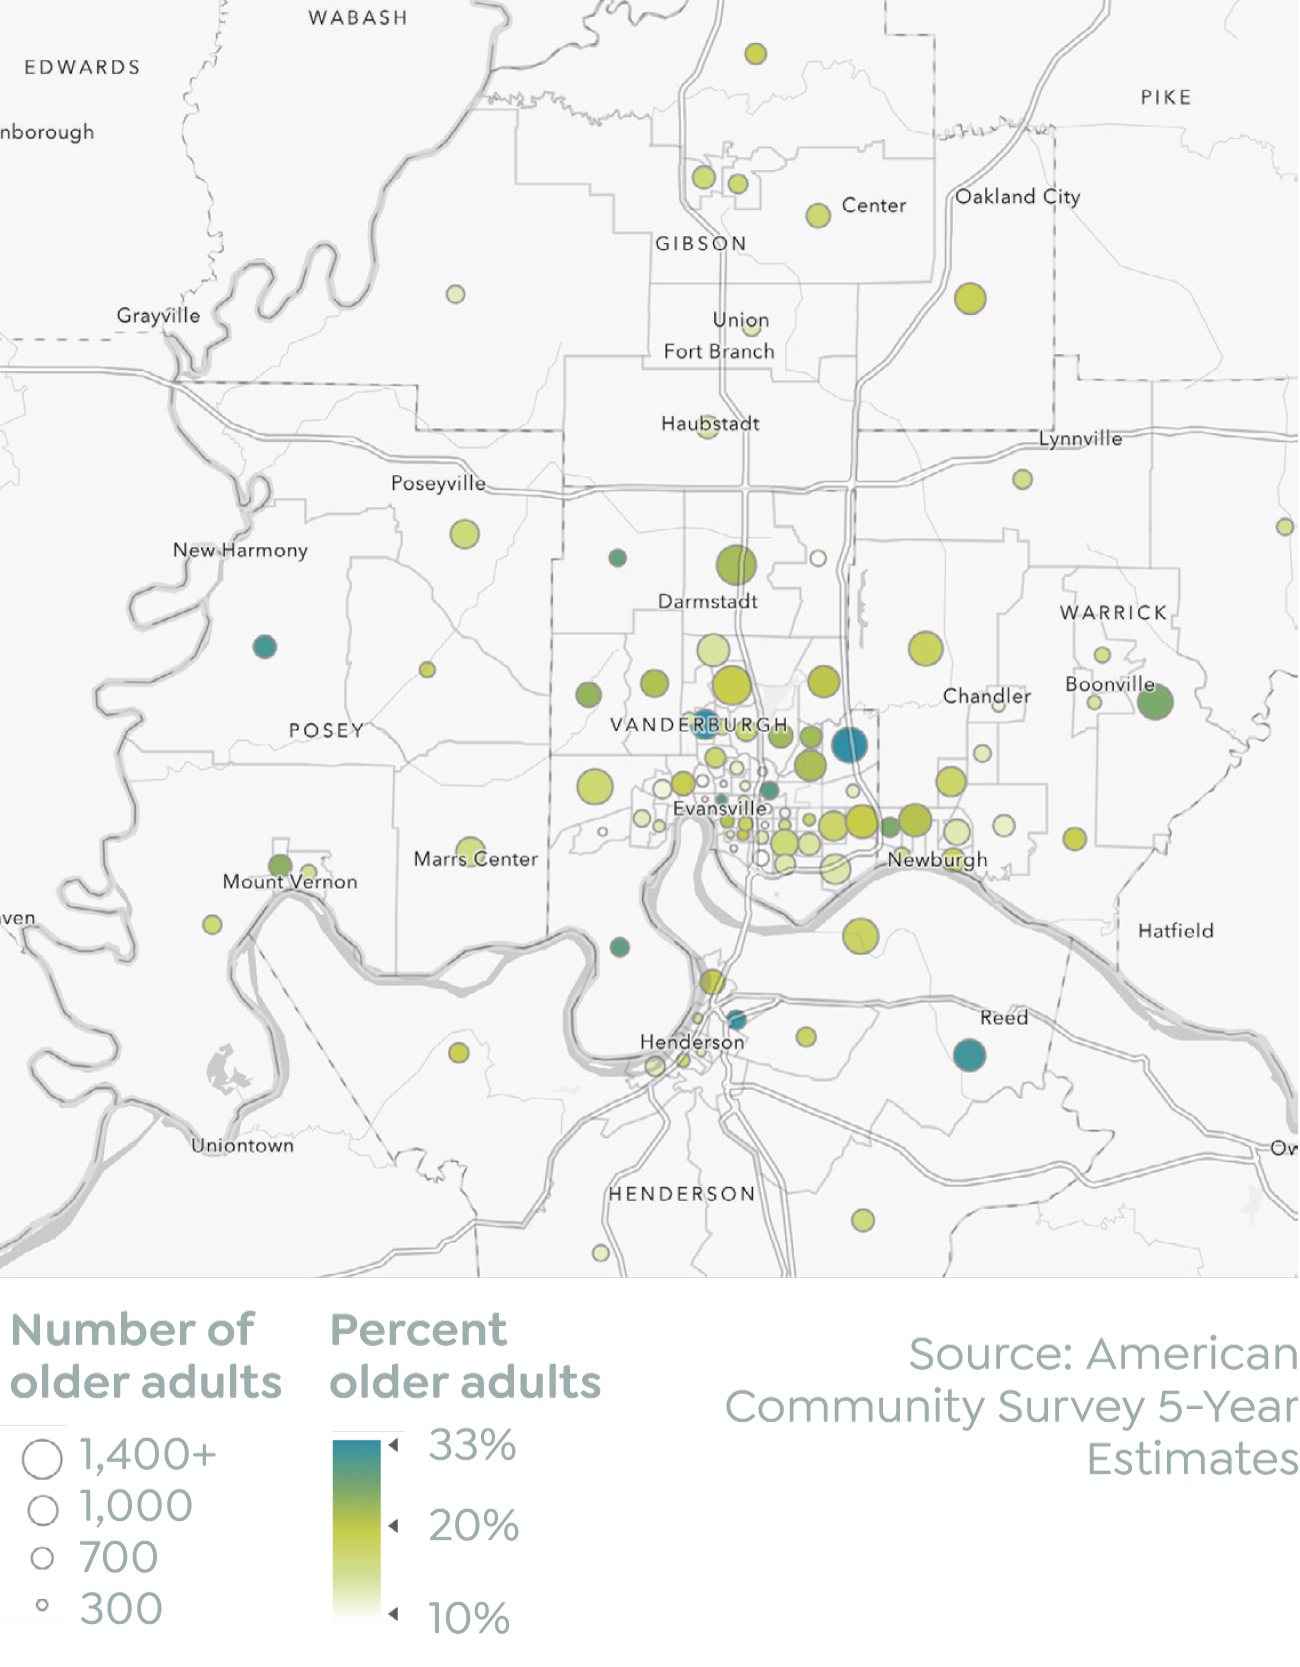
There are 62,000 people aged 65 or older in the region. Most neighborhoods in central Evansville have low concentrations of older adults. However, there is one exception. In a census tract that falls into southern Jacobsville, 30% of the residents are at least 65 years old.
There are three other tracts in Vanderburgh County where older adults make up a third of the population. In a tract near Wesselman Park, almost 600 older adults account for 30% of the population.
On the northeast side, the suburban area near Lynch Road and Interstate 69 is home to 1,200 older adults making up 33% of the population. On the north side, 1,000 older adults live in the neighborhoods surrounding Central High School and account for 33% of the population.
Other areas where seniors make up a large share of the population include rural areas near New Harmony, the eastern outskirts of Henderson County, and northeastern Henderson, Kentucky. However, due to the overall density, most seniors reside in Vanderburgh County itself.
Vanderburgh County neighborhoods have the highest number or seniors, and some have the highest proportion, too.
Population aged 65 and older, count and percentage by census tract
Population by Race/Ethnicity
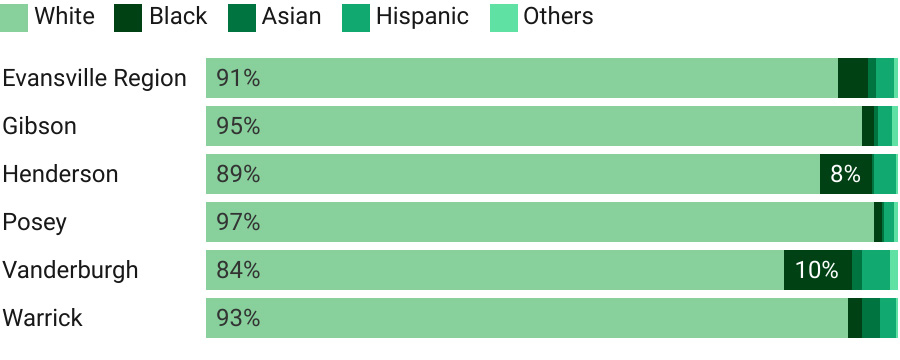
According to 2022 Census data, nearly 91 % of the Greater Evansville Region’s population is White, followed by Black (4%), Hispanic (3%), and Asian (1%). Posey County has the highest White population (97%), followed by Gibson (94%) and Warrick (93%). Compared to the region average, Vanderburgh has the lowest percentage of White population (84%) and the highest percentages of Black (10%), Asian (1.4%), and Hispanic (4%) population. This breakdown in the core of Vanderburgh County indicates a high level of racial diversity as the County has the highest percentage of non-White population in the Greater Evansville Region. Henderson County has the second-highest proportion of people of color, where eight percent of residents are Black.
One editor of this report, who lives in Downtown Evansville, notes a lived experience of a significant growth of the Asian population in his Census Tract that is not represented in the data. For example, one apartment complex in the tract houses some very high-income tenants, while others are planned or already in development, which differs from the existing income distribution data. In short, downtown Evansville may change demographically faster than the existing data can keep up with.
Vanderburgh and Henderson are the most diverse counties in the Greater Evansville Region
Percent of population by race
Source: American Community Survey 2022 5-Year Estimates
Foreign Born Population (Immigrants)
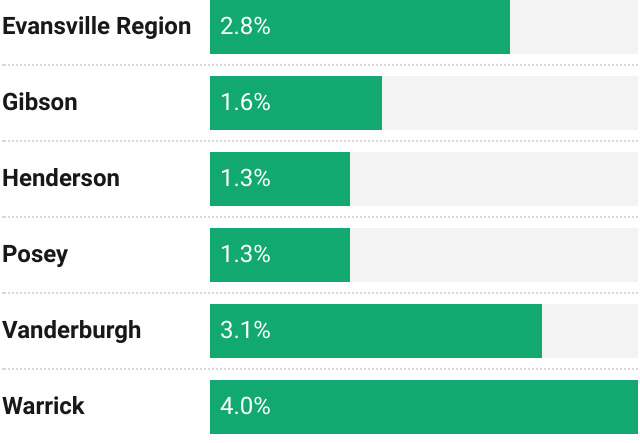
The Greater Evansville Region has a lower proportion of foreign-born residents (2.8%) than the state average (5.6%), but this difference is shrinking as the foreign-born population grows. However, the undercounting of foreign-born populations in Census data and surveys may be influenced by a combination of factors like fear of deportation, language barriers, lack of knowledge regarding technology, mobility, and distrust in government. One reviewer of this report also noted that foreign-born populations may include themselves in “Black” or other categories to add to the under-representation of specific nationalities and ethnicities.
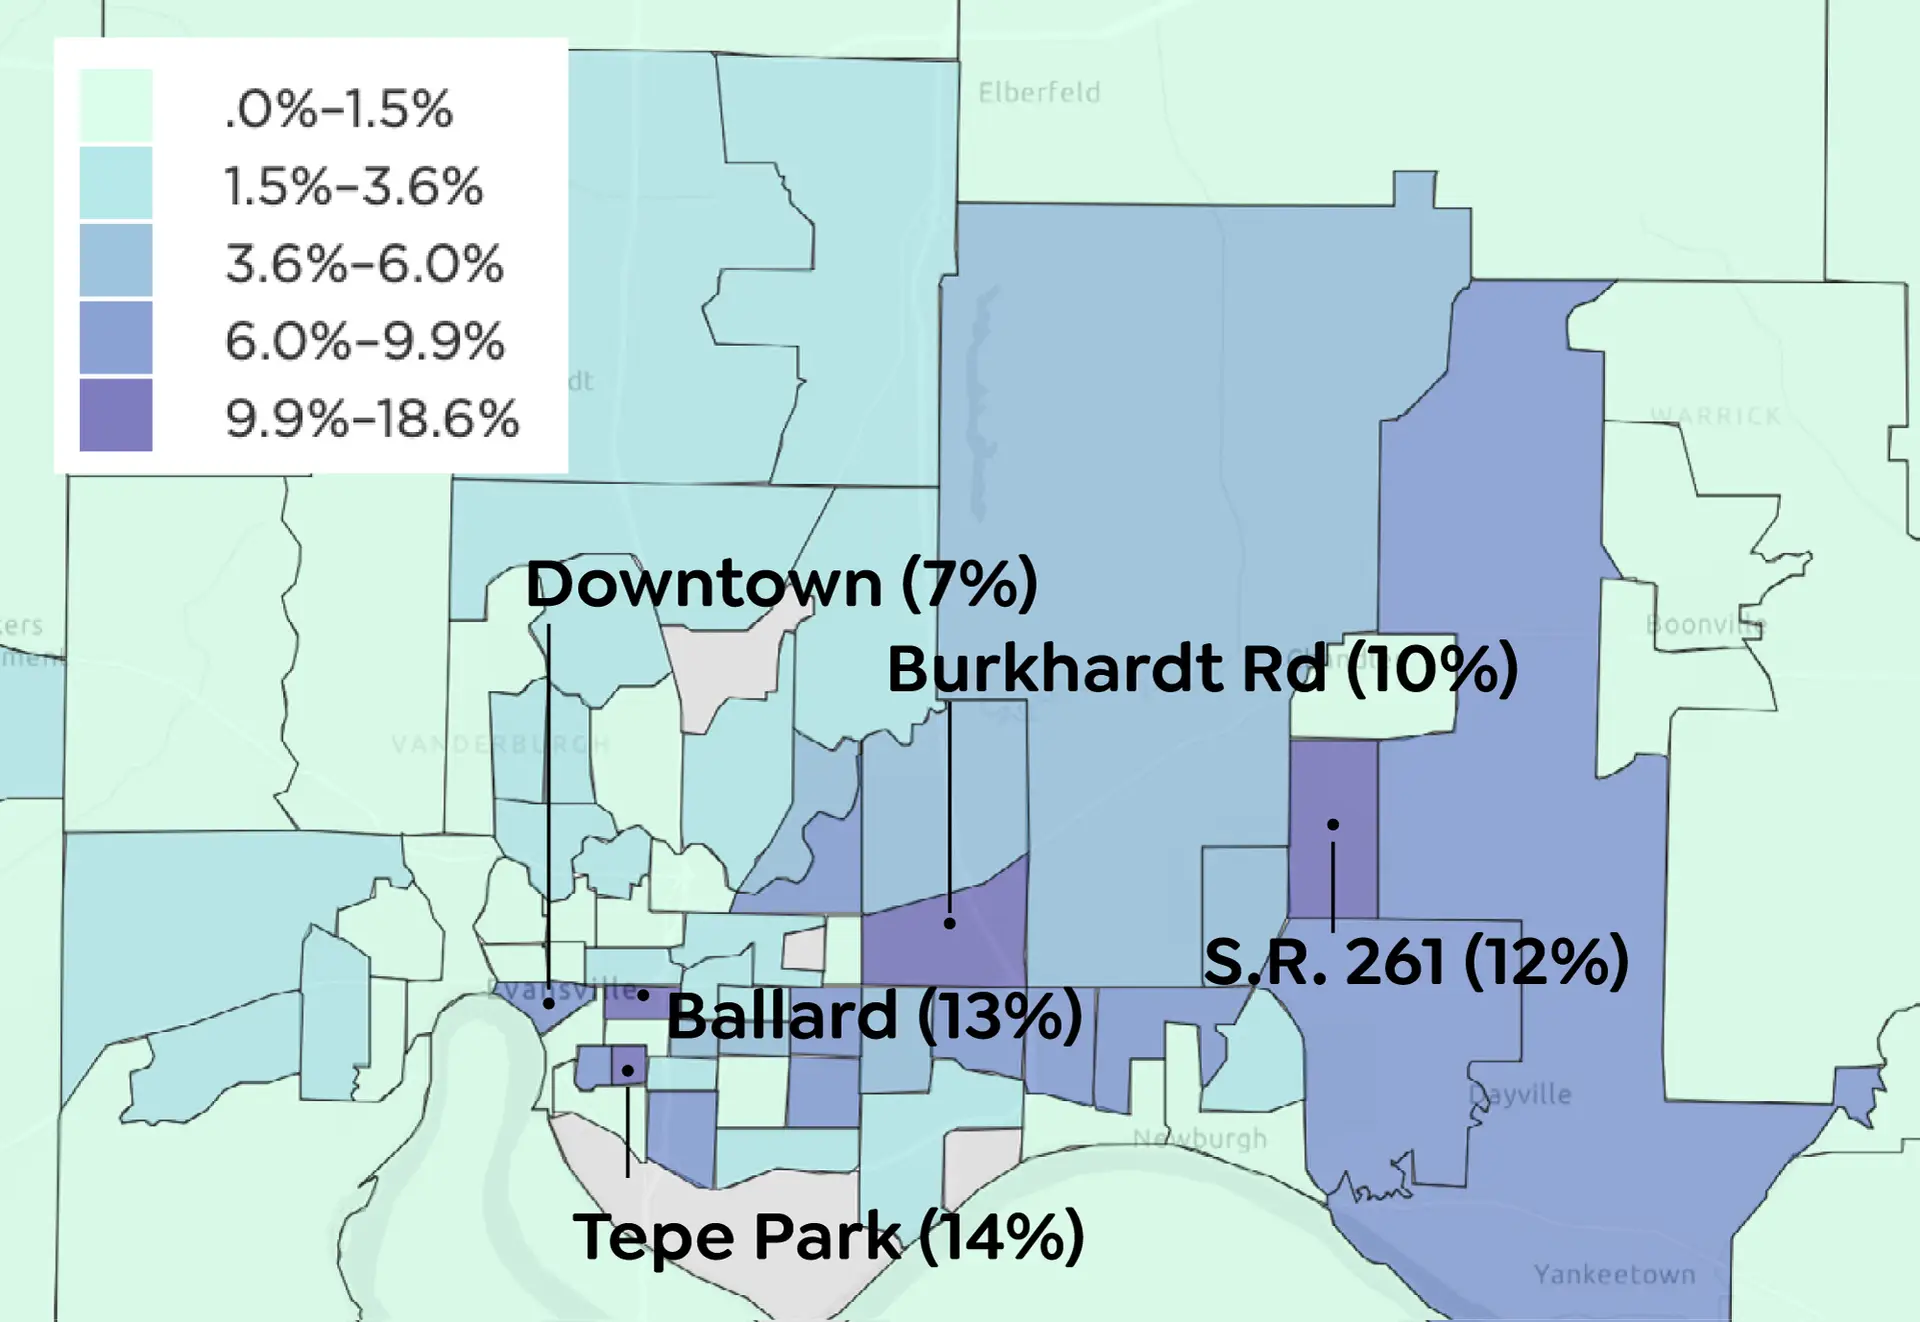
In some census tracts, the foreign-born population makes up as much as 10-15% of the total population. These are located in the core of Evansville, on the east side, and in Warrick County.
Tepe Park is a diverse neighborhood east of Goosetown. In 2015, the Census Bureau estimated there were no foreign-born residents in this neighborhood. That grew to 6% in 2020 and 14% by 2022. By ethnicity (separate from foreign-born status), 8.5% of the population are from the Marshall Islands, 0.9% are Chinese, and 7.2% are Latino (mostly from Mexico and Guatemala).
Warrick County has the highest share of foreign-born residents
Percent of population born outside the United States
Source: American Community Survey 2022 5-Year Estimates
Neighborhood Maps
Foreign-born population
Speaking Hatian Creole
Ballard is just north of Tepe Park. The foreign-born population grew from 2.3% in 2020 to 13.3% in 2022 as Latinos grew to make up 10.2% of the population and Asians grew to 3.1%. Filipinos, Koreans, and Indians each make up about 1% of the population here. Downtown, Asians grew from 0% of the population in 2020 to 7.3% in 2022. This is from growth in the Korean population (5.1% of population) and the Chinese population (2.2% of the population. Foreign-born residents make up 7.0% of residents.
In the suburban neighborhoods along North Burkhart Road, the foreign-born population increased from 3.2% in 2019 to 10.3% in 2020 as the share of people from Mexico doubled from 2% to 4%. Further east, neighborhoods near Paradise along S.R. 261 have grown to include 13.1% foreign-born residents, driven by an increase in Indian and Chinese residents.
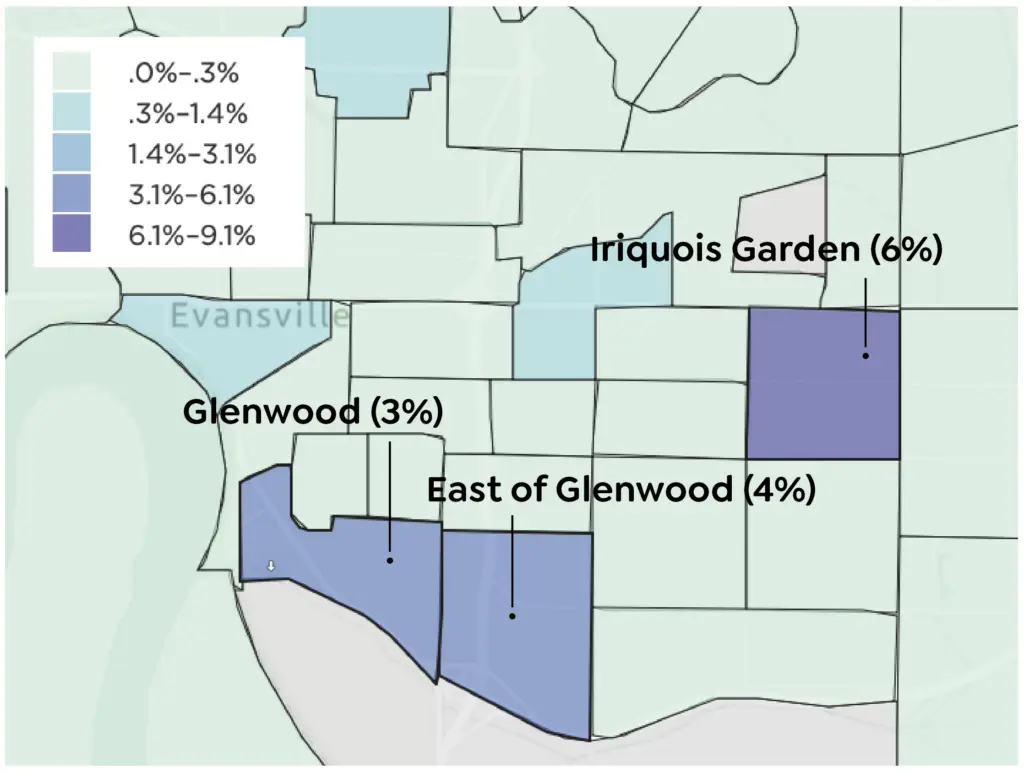
Language is another indicator of ethnicity and nationality, and Haitian Creole, while not the dominant language regionally, is spoken by 3-6% of the population in certain neighborhoods.
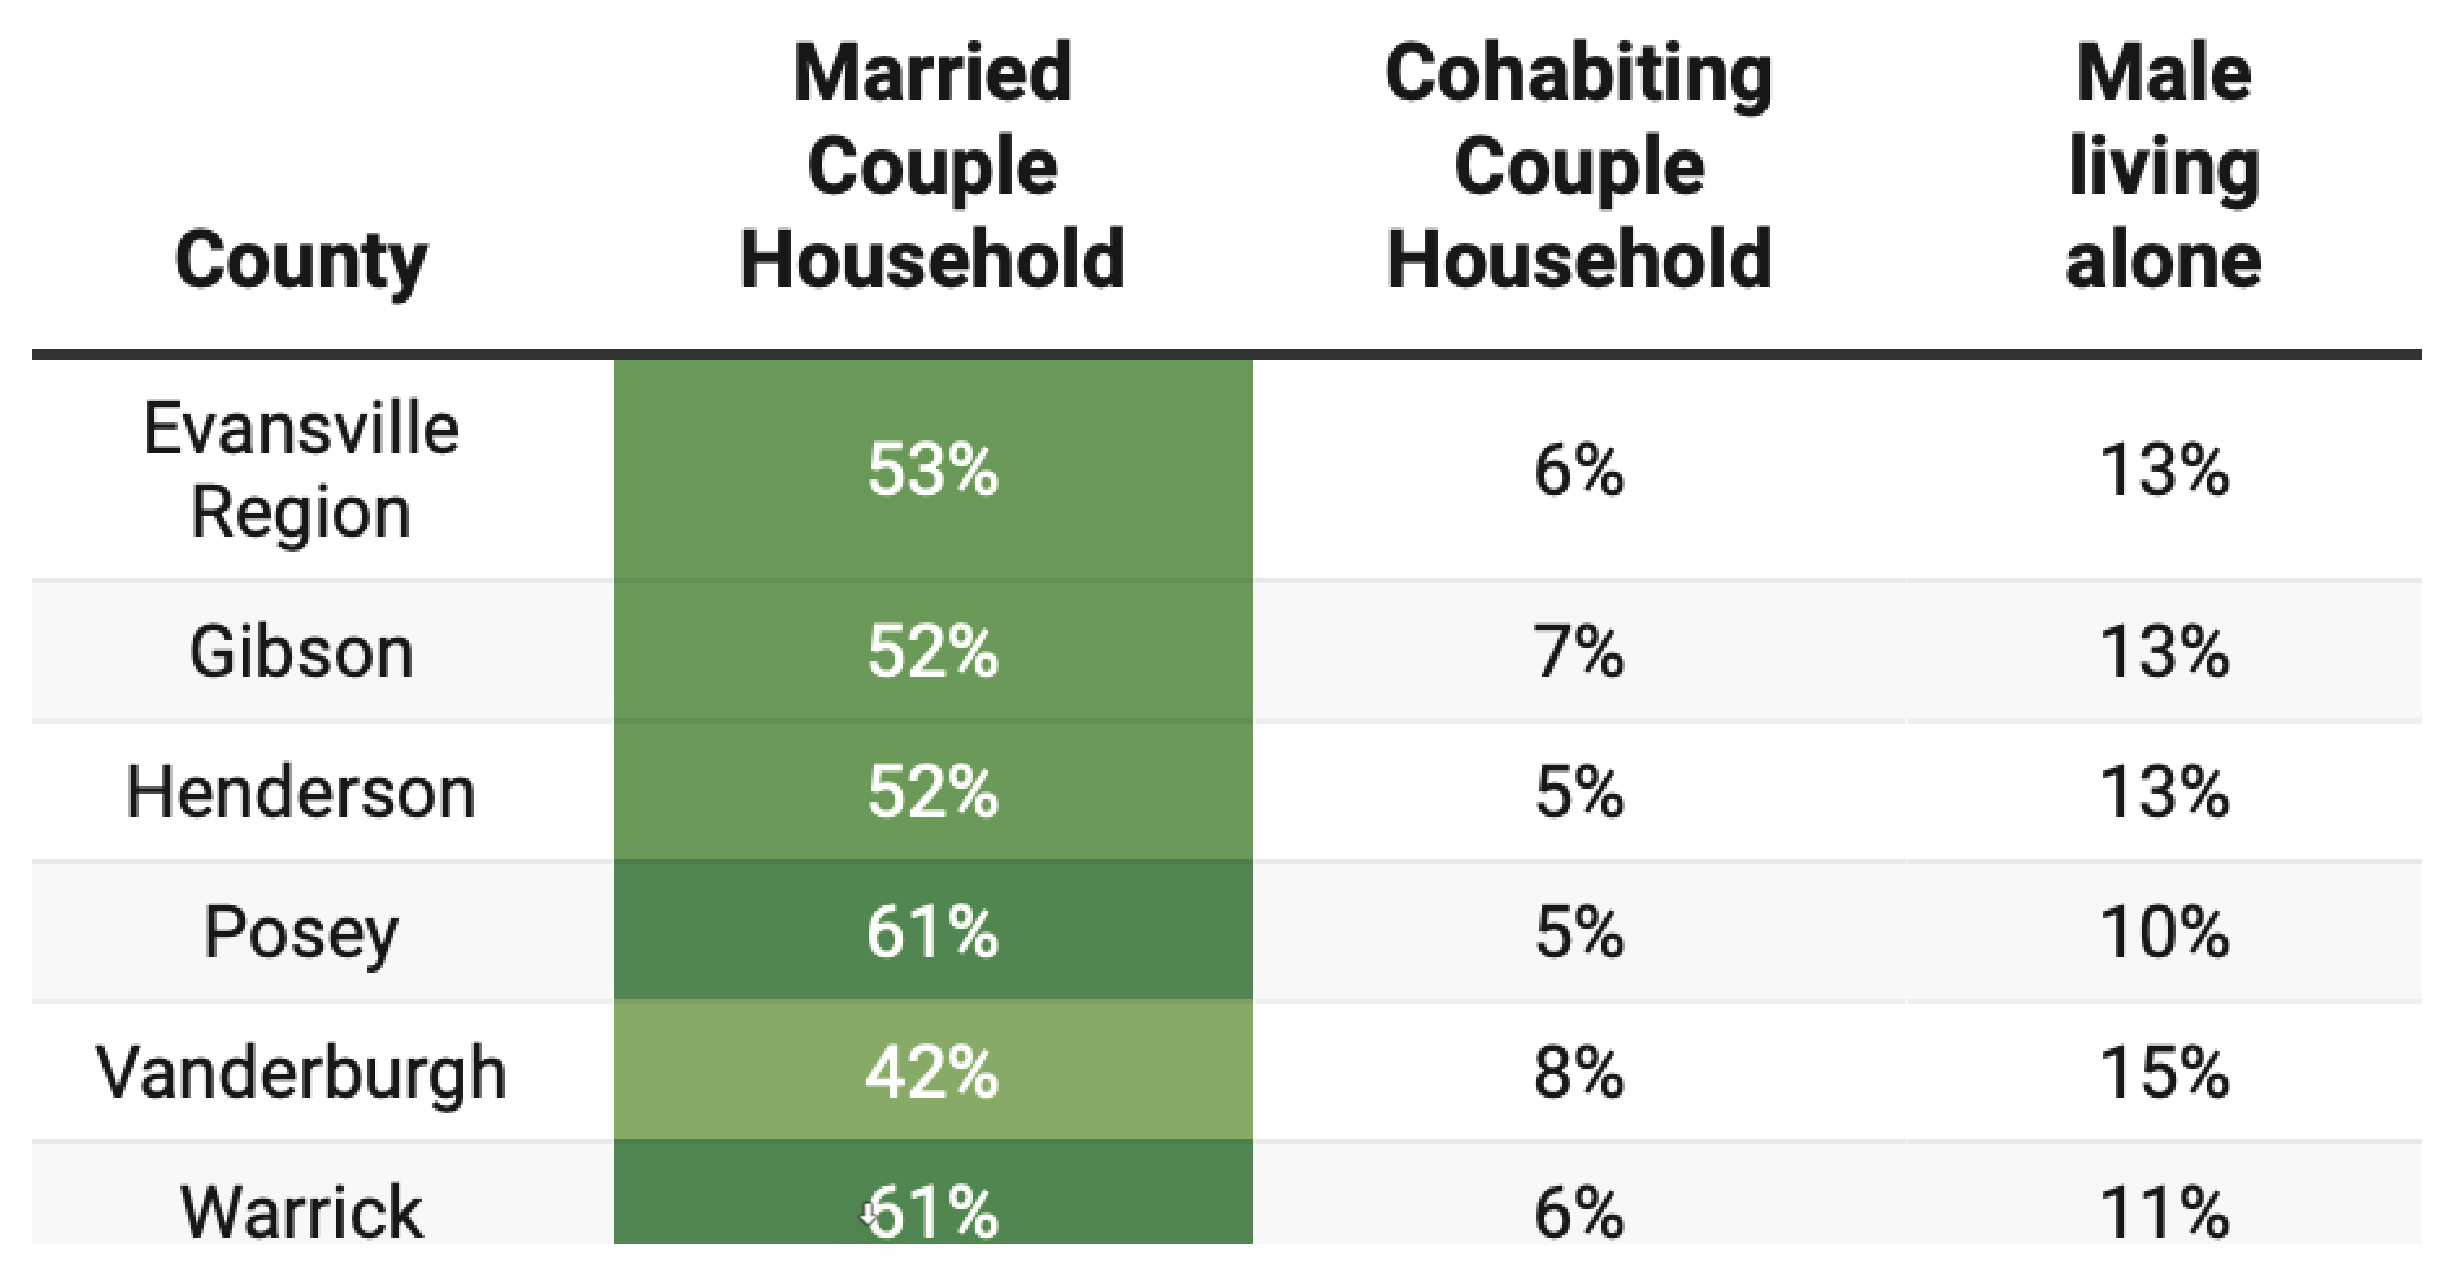
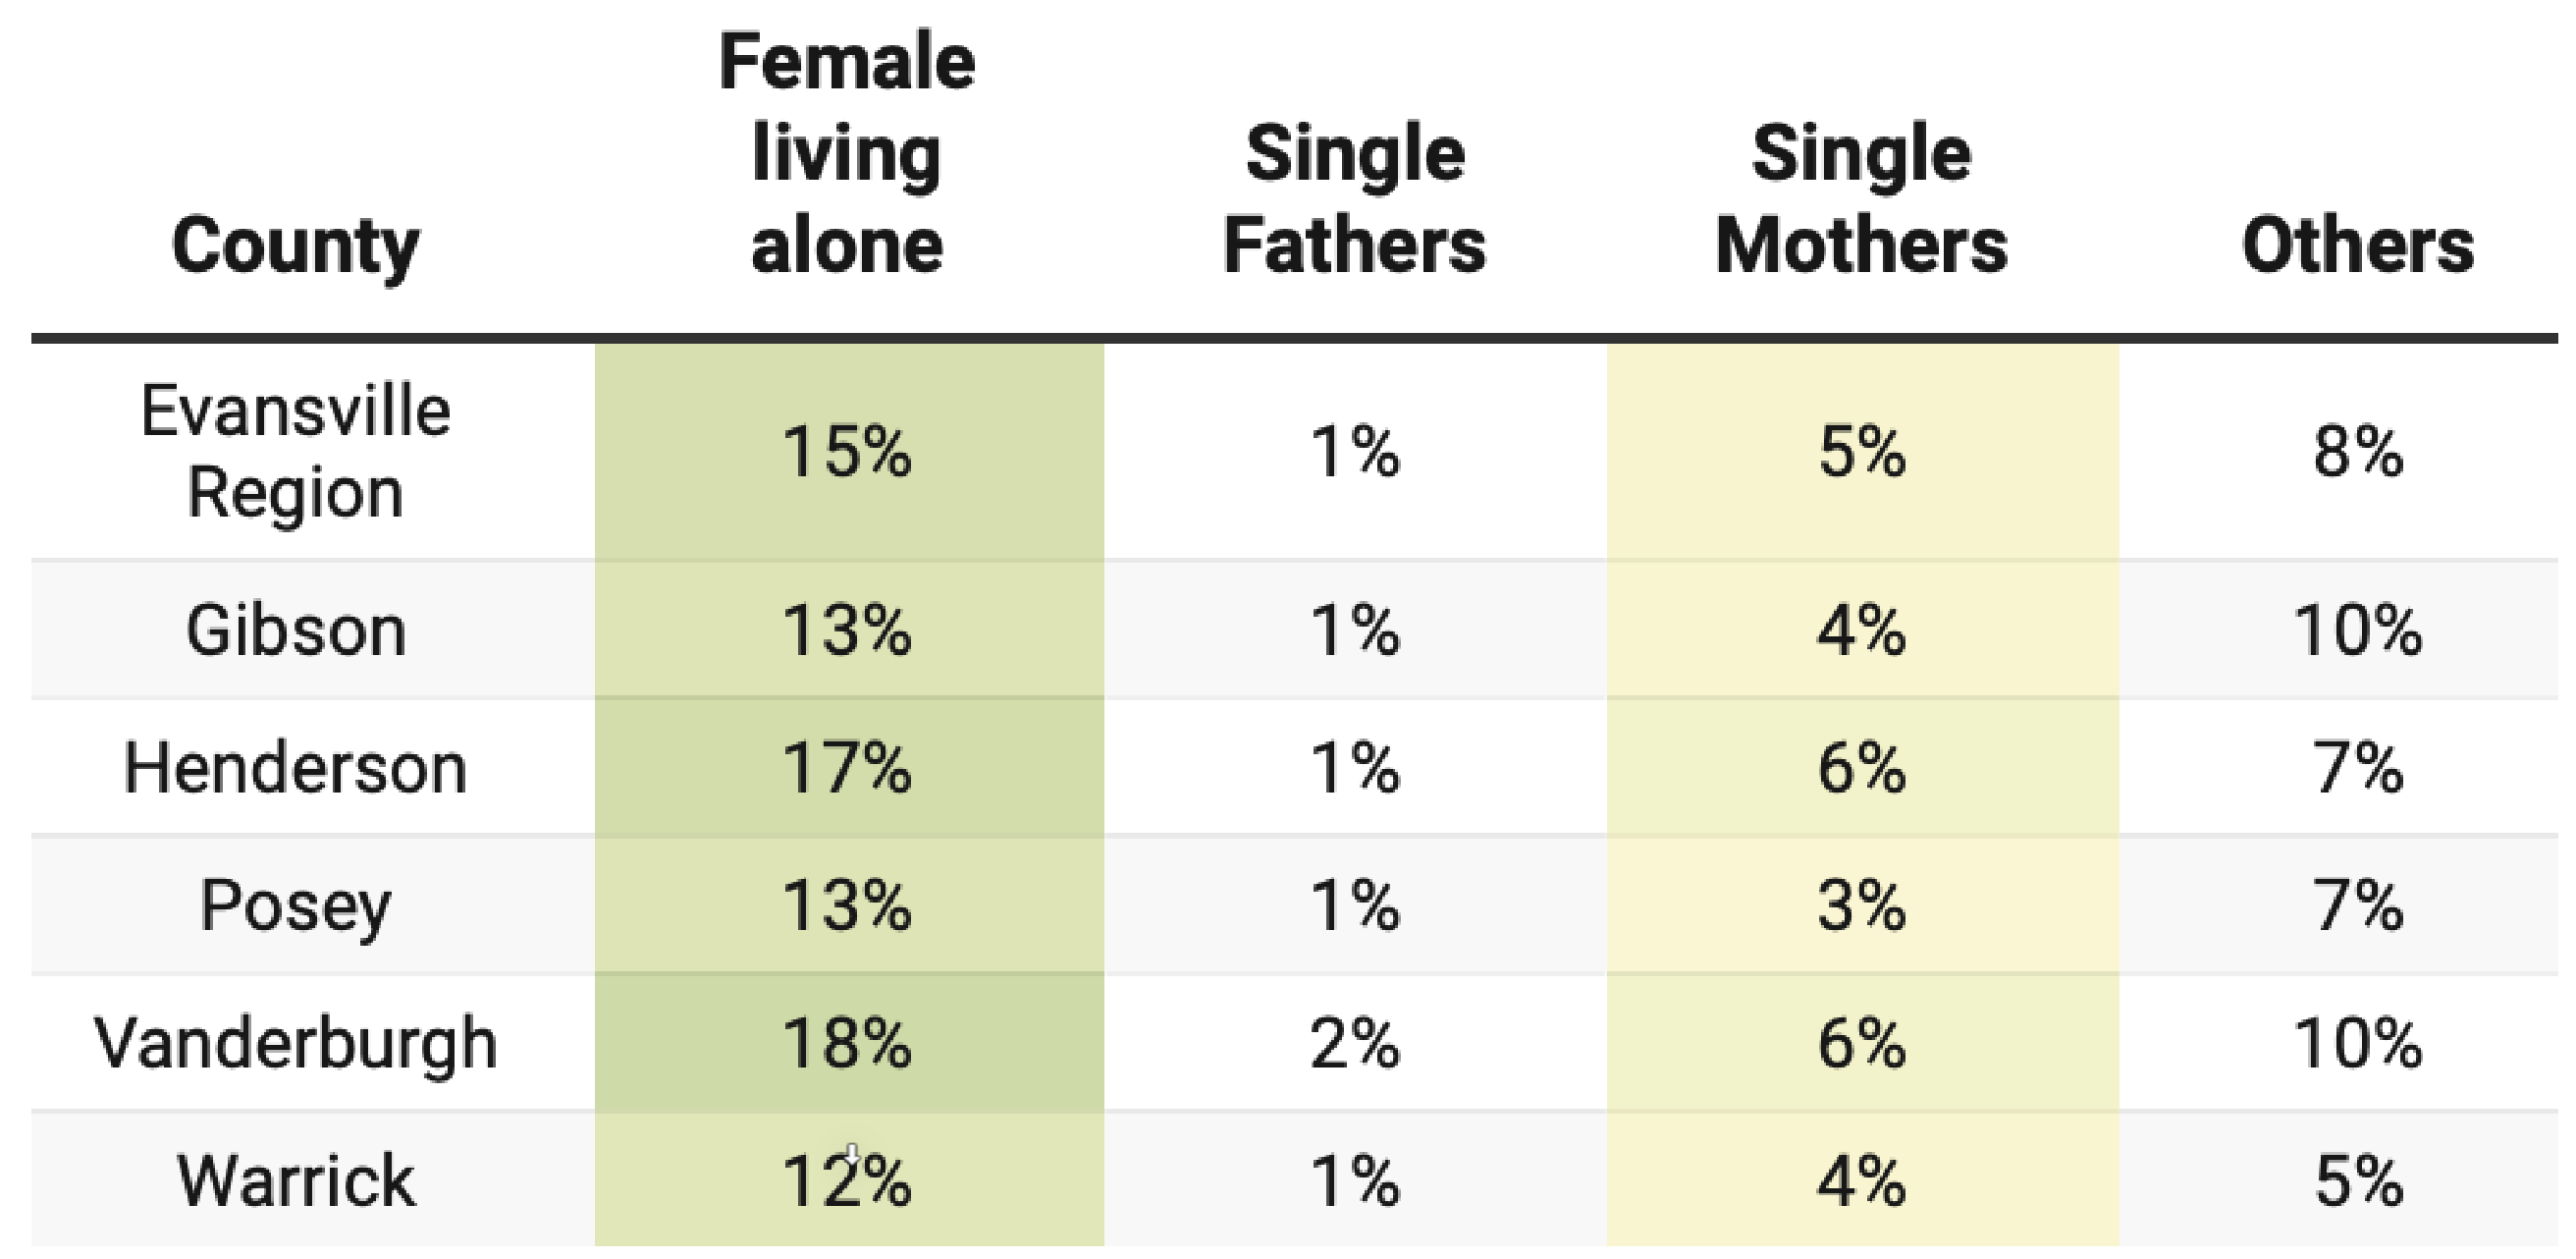
Proportions of household types by county
Household types and marriage
Household types by marriage offer useful information about families’ socio-economic and demographic dynamics. Marital status impacts household composition, health and well-being, child-rearing practices, and economic solvency. For example, married couples may have higher combined income than unmarried cohabiting couples and other couple types. In addition, single parents may face more challenges in areas such as financial resources, social support, and parental stress.
Across the region, Vanderburgh County has the lowest percentage of married couple households (42%) and the highest rate of female households living alone (18%) in 2022. Posey has the highest percentage (61%) of married couple households. Five percent of the region’s households are single mothers with children under 18. One percent are single fathers. In Vanderburgh County, 6% of households are single mothers, and 2% are single fathers. Women in the Evansville region are more likely than men to live alone.
Eighty-nine percent of coupled households in the Greater Evansville Region are made of opposite-sex spouses, followed by opposite-sex unmarried partners (10%), same-sex spouses (0.9%), and same-sex unmarried partners (0.4%). Posey County has the highest percentage of opposite-sex spouses (93%), and Vanderburgh County has the lowest (82%). Vanderburgh also has the highest number of same-sex spouses (1.5%) and same-sex unmarried partners (1.2%).
In the region, 54% of men and women over 14 are married. One-fifth of women have never married, while this rate is one-third for men. Women are three times more likely than men to be widows. These rates do not vary much by county, except the marriage rate for women in Vanderburgh. With 44% of women married, Vanderburgh County is home to many more single women than other counties. Forty-nine percent of men are married in Vanderburgh County, slightly lower than the regional rate.
Half of men and women are married, while men are more likely to not marry and women are more likely to become widows
Marital status by gender

Notes
- MacLeod, James Lachlan. Lost Evansville. Arcadia Publishing, 2023.
- Thomas B. Langhorne (2022). COVID’s impact on Evansville is clear in Census Bureau’s new population information. Access link: https://www.courierpress.com/story/news/local/2022/06/15/covid-19-impact-vanderburgh-county-evansville-indiana-population-census-bureau/7571883001/
- Stempowski, D. Counting Every Voice: Understanding Hard-to-Count and Historically Undercounted Populations. U.S. Nov. 7, 2023. Census Bureau. Access link: https://www.census.gov/newsroom/blogs/random-samplings/2023/10/understanding-undercounted-populations.html
Where You Live Matters is a product of Grow
in partnership with The Polis Center.
Guide