Coal and its easy transport on the Ohio River have fueled Evansville’s economy historically, but the proximity to coal mines and coalburning power plants is having an impact on the region’s environment.
37,000 people (11%) live in areas that are among the five percent most environmentally burdened census tracts in the nation.
Asthma rates are highest in central Evansville, where air pollution levels are elevated.
144,000 people live in areas that are among the nation’s 30% worst in terms of polluted streams and rivers.
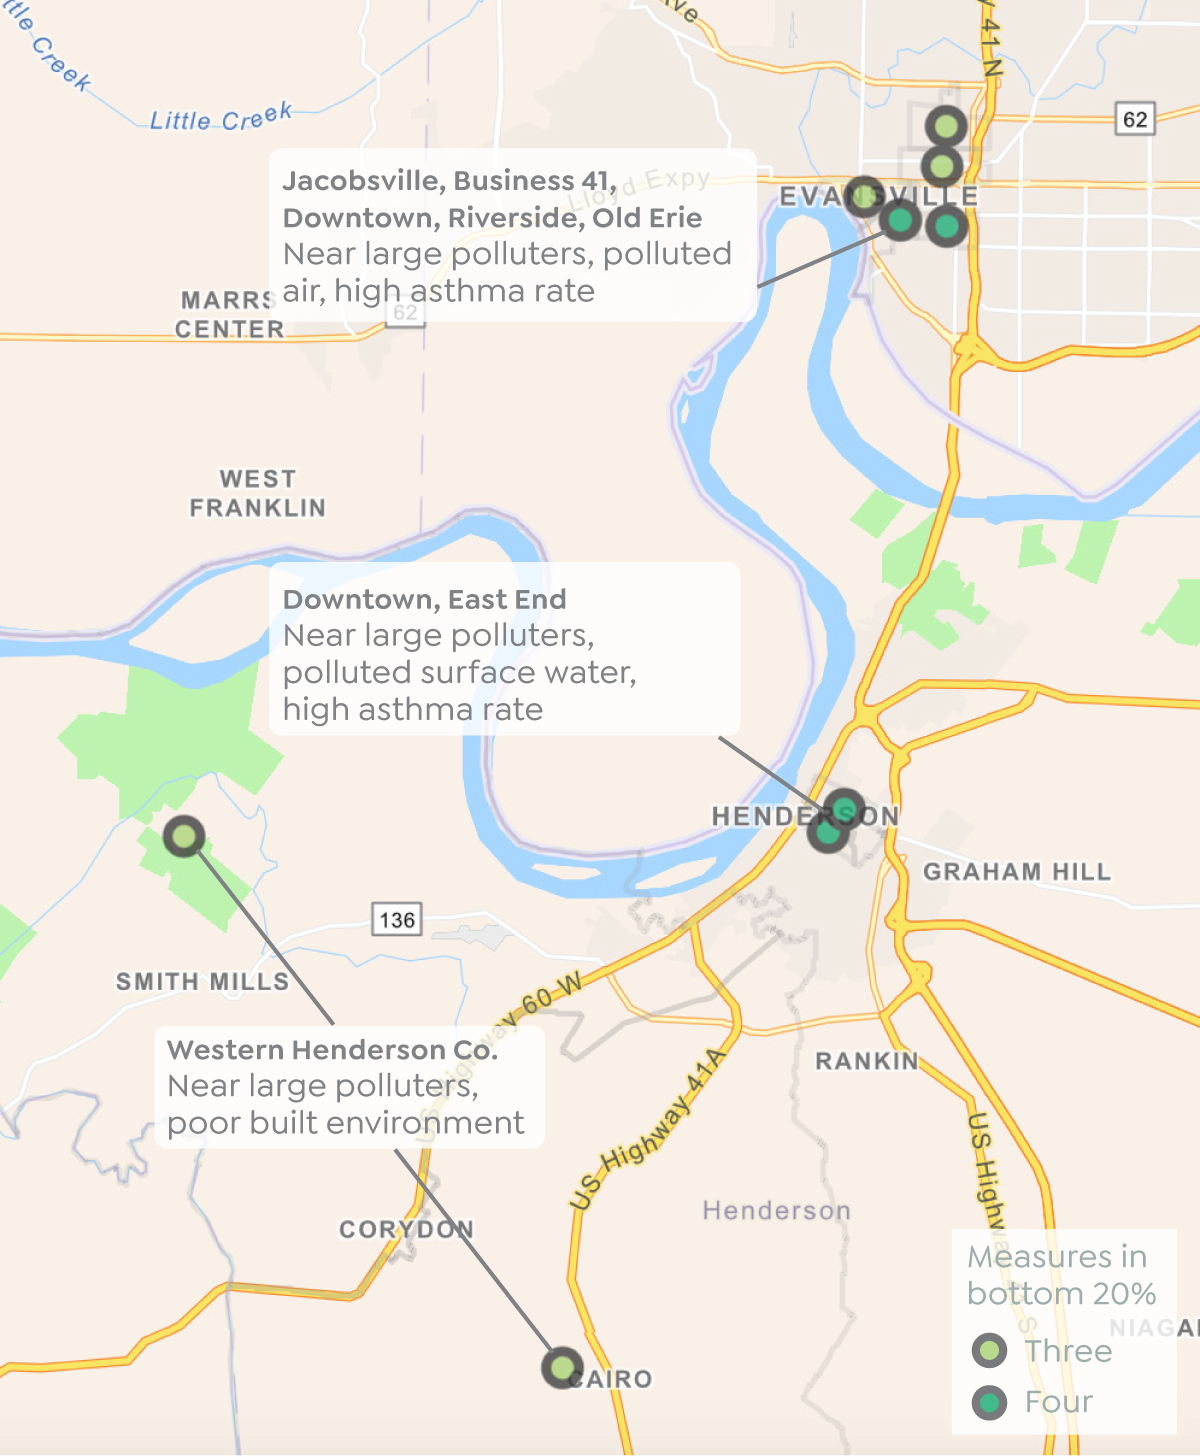
Where you live matters
These areas ranked in the bottom 20% for at least three of these six environmental statistics: pollution (air, water, and point-source), built environment, total environmental burden, and asthma rates.
The environment where a person lives contributes to health and wellbeing in both positive and negative ways. Living in walkable areas with access to parks can make residents healthier1 and happier,2 while living amidst pollution increases risk of cancer3 and asthma.4 Overall, environmental burden is highest in central Evansville neighborhoods and distant suburban communities that are near large polluters. Asthma is highest in central Evansville, where exposure to air pollution is also highest.
Environmental Burden
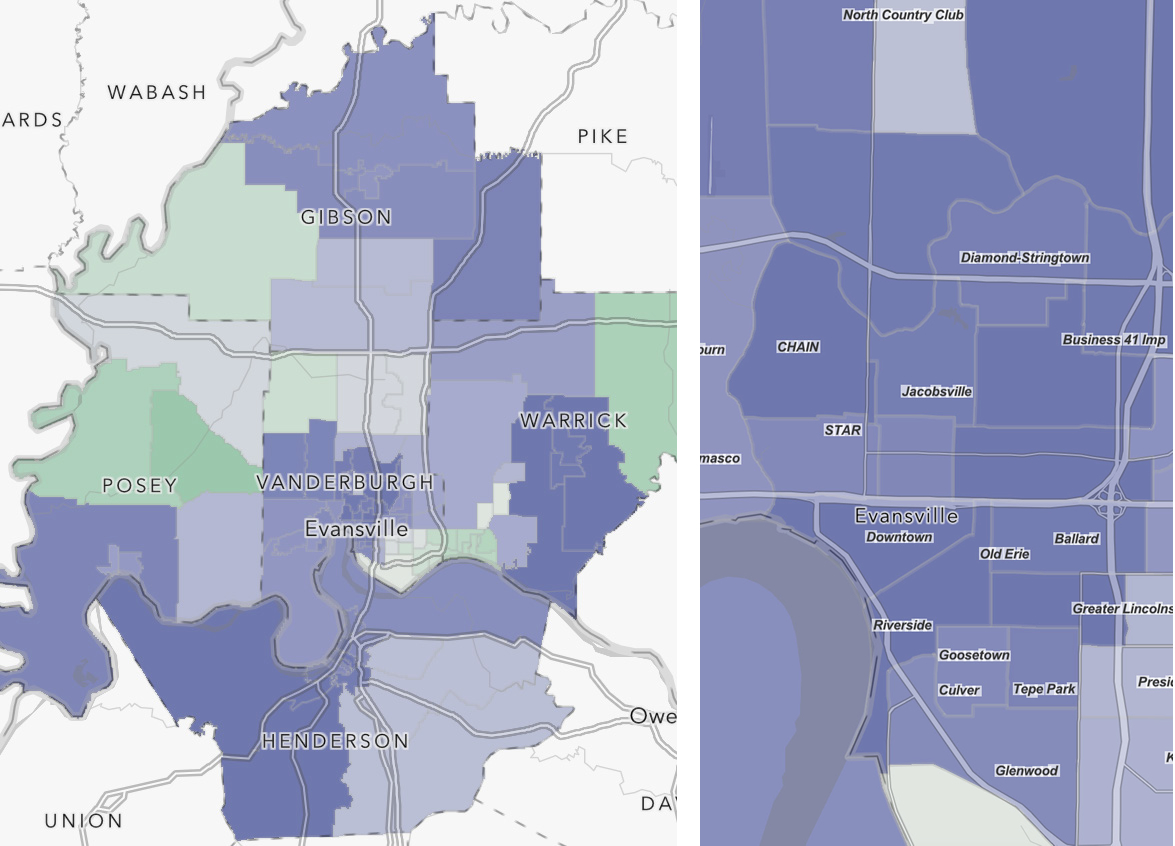
National Ranking for Total Environmental Burden
Rank compared to all U.S. census tracts
Source: 2022 CDC Environmental Justice Index
The U.S. Centers for Disease Control and Prevention produces an index of environmental indicators for every census tract in the nation, and the total impact of all pollutants and the built environment is estimated as the “Total Environmental Burden.”
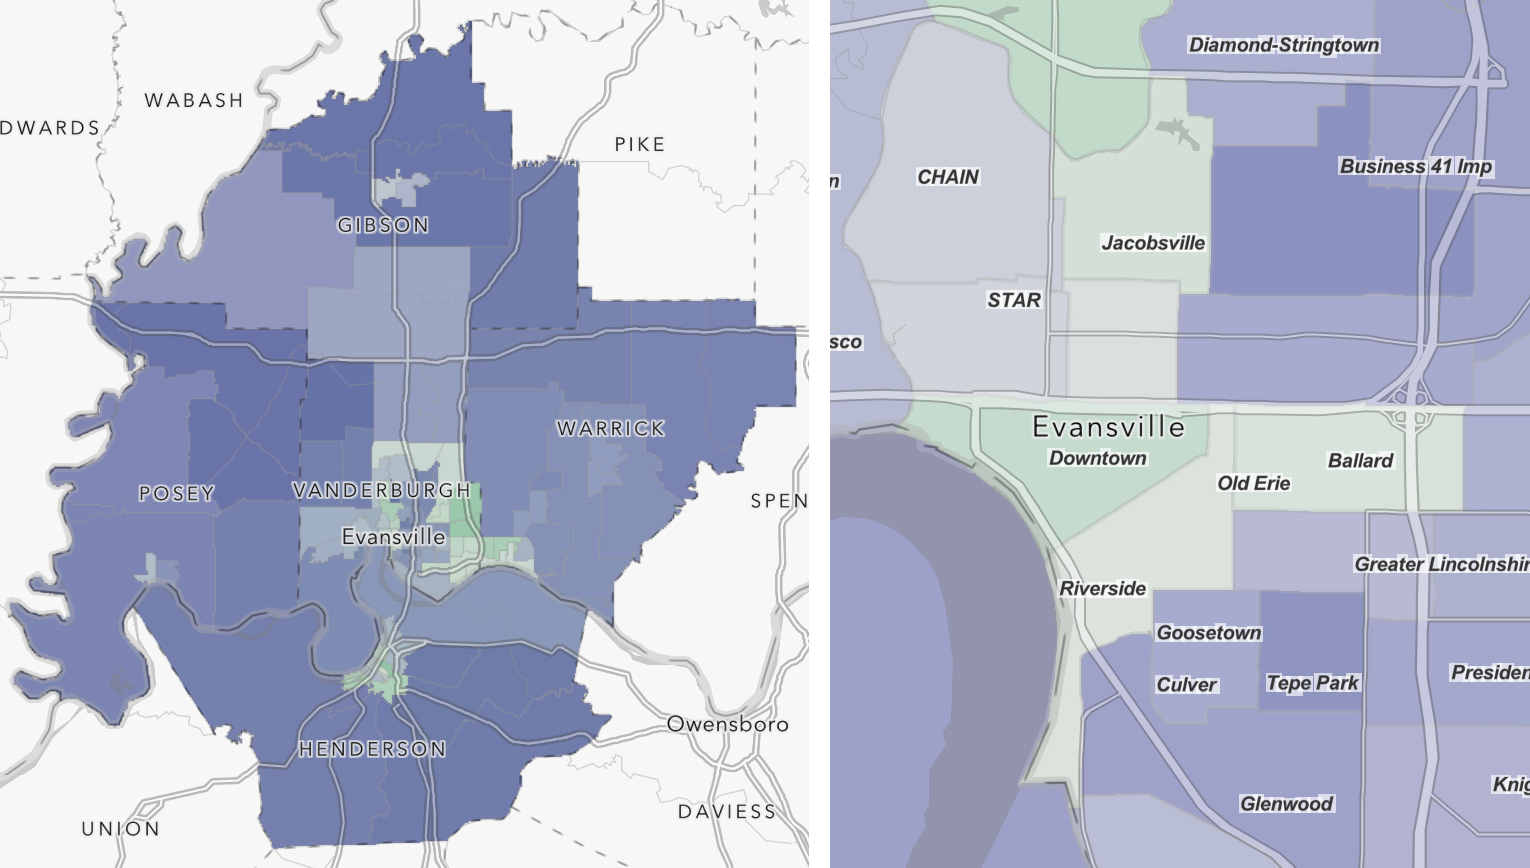
There are fourteen census tracts in the Greater Evansville Region with a worse environmental burden than 95% of the country. These tracts represent 37,000 residents or 11% or the region’s population. They are located in three areas: central Evansville, Warrick County, and Henderson County, Kentucky. The central Evansville neighborhoods neighborhoods in this category include Downtown, Riverside, CCIA, and Bellemeade Bayard Park, Chain, and eastern Jacobsville.
In Henderson County and Warrick County, the drivers of environmental burden are similar: potentially toxic sites and poor walkability. These areas are home to many coal mines. Parts of both counties are in top one percent of the U.S. in proximity to coal mines. Henderson County is also downwind from the A.B. Brown Power Plant, a gas-fired power plant. The plant retired its two coal-fired units in October 2023, with new environmental data forthcoming. These areas also rank worse than most of the country in terms of walkability and access to parks.
In central Evansville, causes of environmental burden are different. Here, air pollution is a significant factor, with higher amounts of particulate matter and pollution from diesel trucks. This is often the case in the center of cities, where residents live close to major highways and industrial traffic travels on arterial roads bordering neighborhoods. Industry itself is the other cause of high environmental burden here. The core of Evansville scores worse than most of the country in terms of proximity to toxic release sites and treatment, storage, and disposal sites.
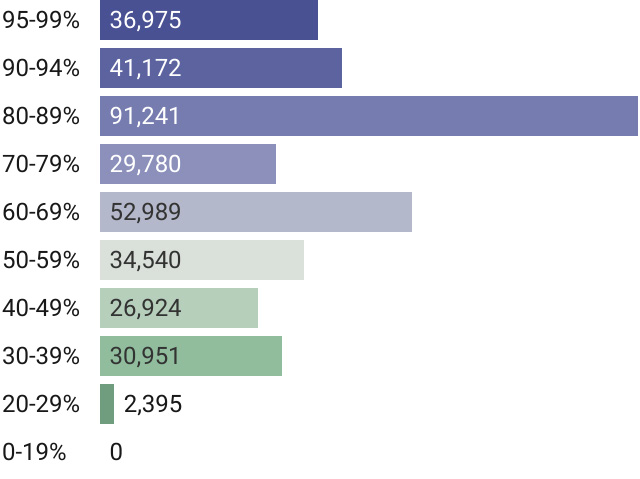
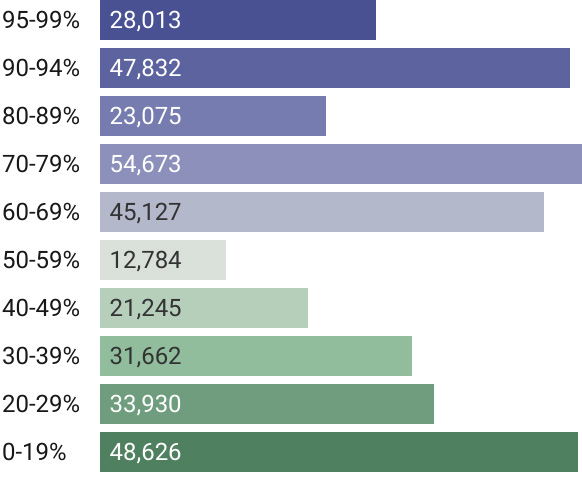
11% of population lives in area with worse environmental burden than 95% of the U.S.
Highlighting census tracts with environmental burden percentile rank of 95 or higher
Population living where environmental burden is worse than…
Source: 2022 CDC Environmental Justice Index
Air Pollution
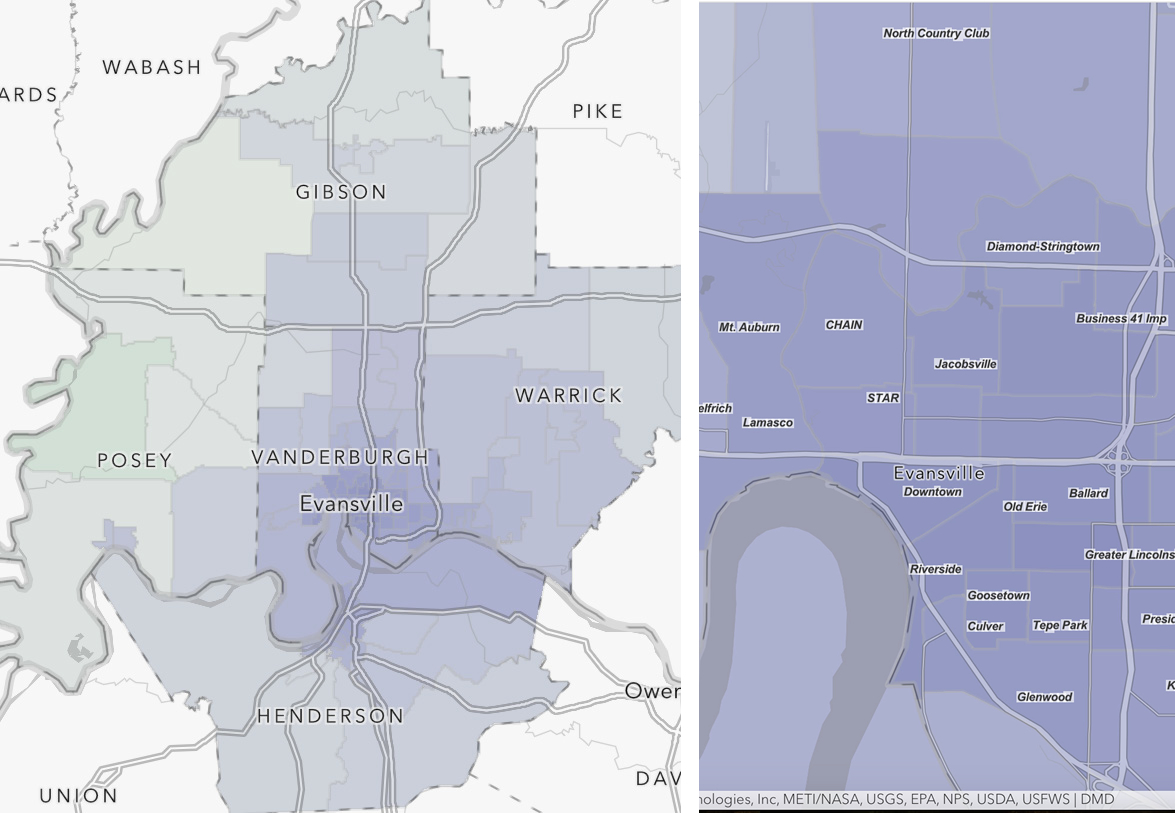
National Ranking for Air Pollution
Rank compared to all U.S. census tracts
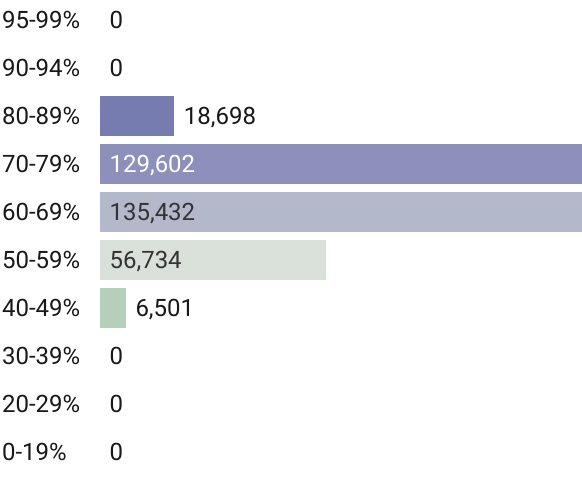
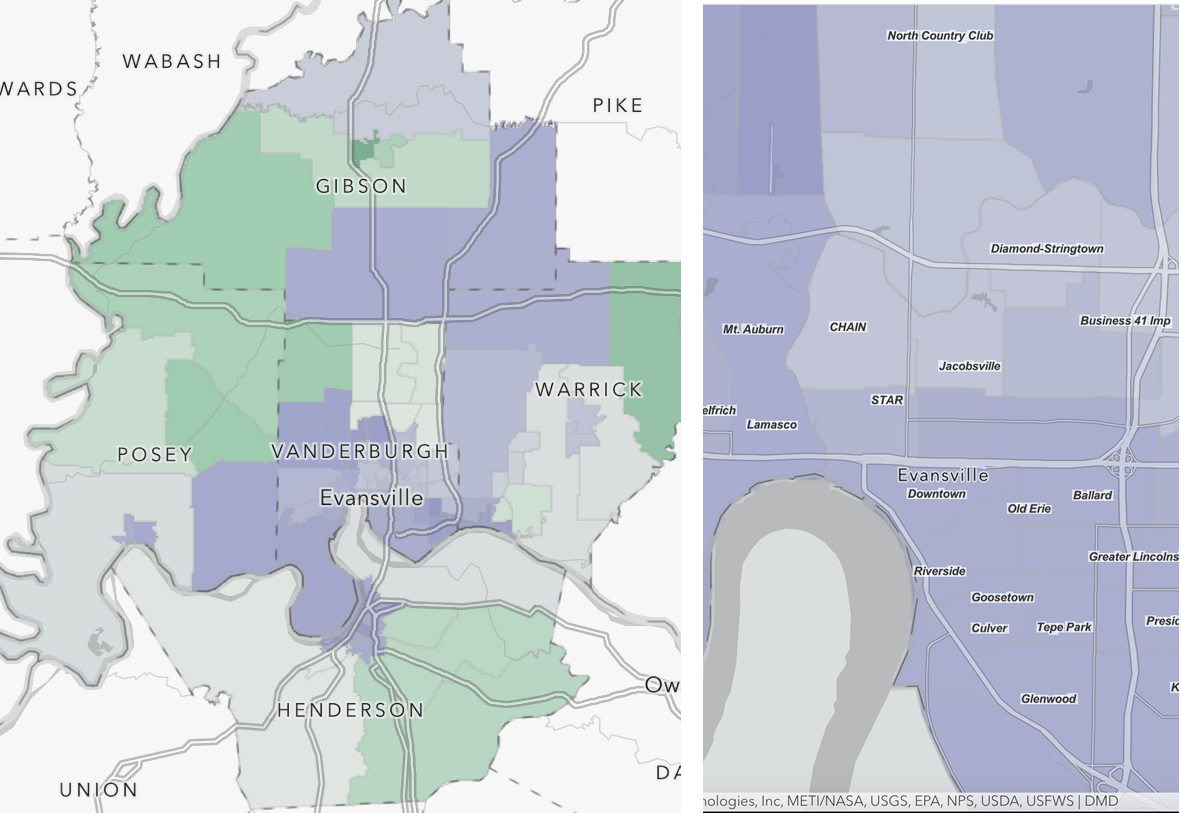
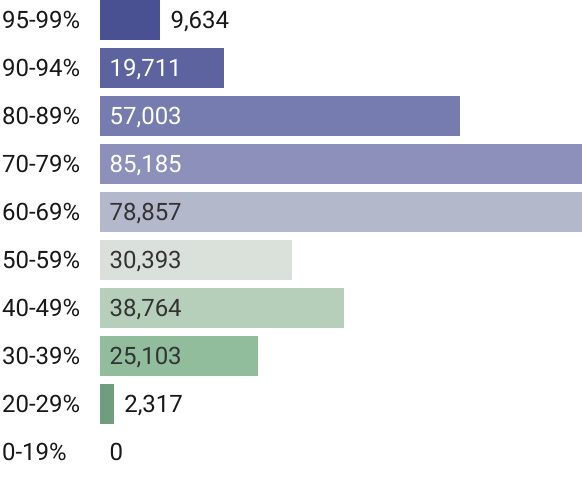
Air pollution is highest in central Evansville and in the center of Henderson, Kentucky. There are 11 census tracts with worse air pollution than 80% of the nation. These are all located south of Diamond Avenue and most are west of Highway 41. They account for 18,700 people.
Overall, Evansville performs better in terms of air pollution than in overall environmental burden. No tracts in Evansville fall into the top 10% of the nation in terms of air pollution.
Population living where air pollution is worse than…
Water Pollution
National Ranking for Water Pollution
Rank compared to all U.S. census tracts
Water Pollution Compared to air pollution and overall environmental burden, water pollution is not as severe of an issue in most of Evansville. This measure is based on a tracts proximity to an impaired watershed. This measure is about surface water, like streams and rivers, and not about drinking water. Pollutants including Dioxin, Mercury, E. coli, and PCBs have been found at harmful levels in the Ohio River between the French Islands (east of Newburgh) and Canoe Creek (west of Henderson). E. coli and PCBs have also been found in Pigeon Creek, and E. coli is present in Little Creek and the Wabash and Erie Canal.5
Population living where air pollution is worse than…
Point-Source Pollution
National Ranking for Point-Source Pollution
Rank compared to all U.S. census tracts
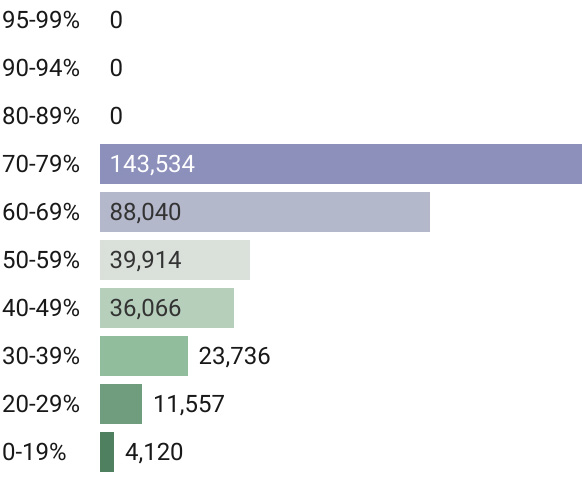
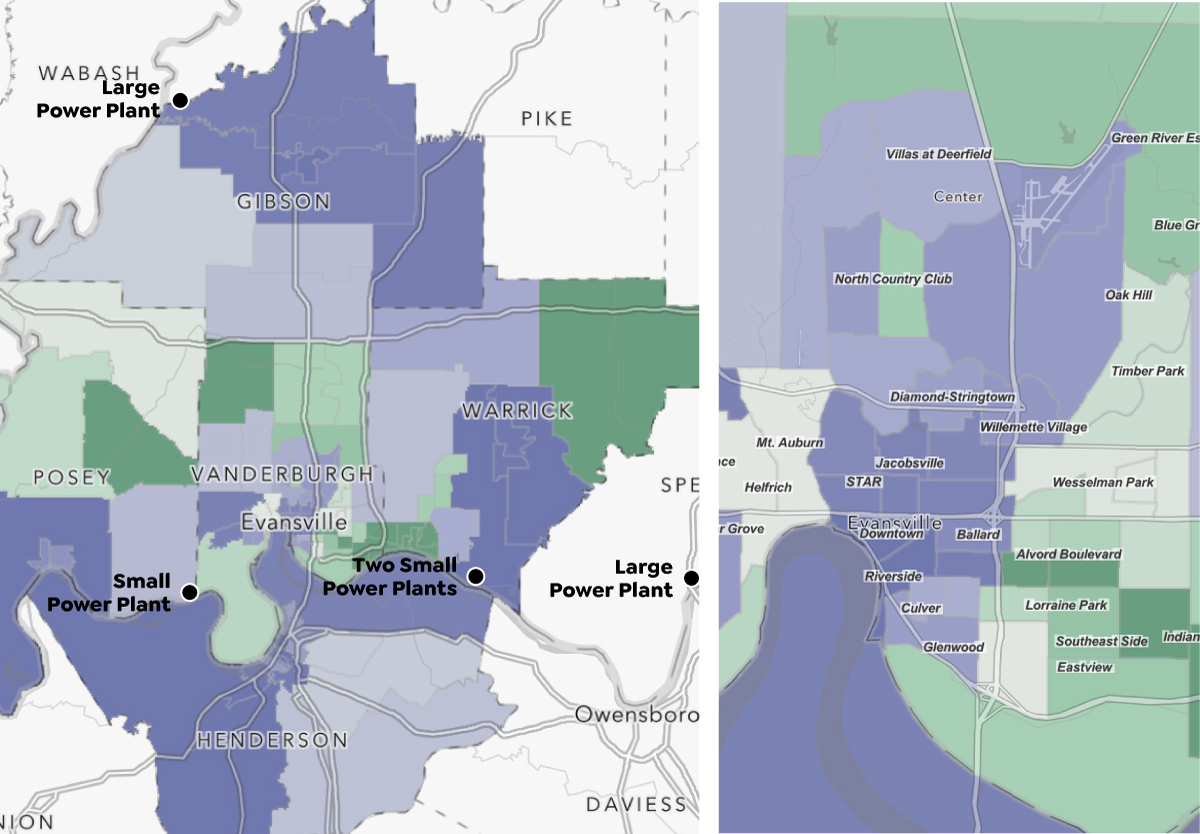
Surface coal mines are prevalent in southwestern Indiana and eastern Kentucky, and this drives up the number of people living near point-source polluters (specific sites that generate or dispose of hazardous and toxic materials). These can also include factories and power plants. The 2,600 megawatt Rockport plant is coal-fired and located just east of the study area. The 3,100 megawatt Gibson Plant is also coal-fired. Much of the region is downwind from this plant. There are other small generating stations along the Ohio River.
This measures diverges widely in the region— most people fall at either the high end or the low end of the spectrum, and few are in the middle. One in five people live in an area that scores worse than 90% of the nation in proximity to point-source pollution, and over 40% live in an area that scores worse than 70% of the nation.
On the other hand, 14% of residents live in an area that are some of cleanest in the nation in terms of point-source pollution, scoring better than 90% of census tracts. One quarter of the region live in an area scoring better than 70% of the U.S.
Population living where point-source pollution is worse than…
Population living where built environment is worse than…
Built Environment
National Ranking for Built Environment
Rank compared to all U.S. census tracts
This measure considers proximity to parks, walkability, and the share of homes built before 1980 (as a risk of exposure to lead-based paint). Rural areas tend to have poor access to parks and poor walkability, but are less exposed to the risk of lead-based paint. Urban areas were built with dense, walkable street grids and parks, but most of the homes are built before 1980. The areas that score best are downtown (where walkability and park access are high) and older suburbs, with a balance of park access and newer homes.
Asthma
We consider asthma rates as just one health impact of pollution, and even then only an impact of air pollution. It is, however, publicly available at neighborhood-level estimates, which make is useful for comparing to air pollution estimates.
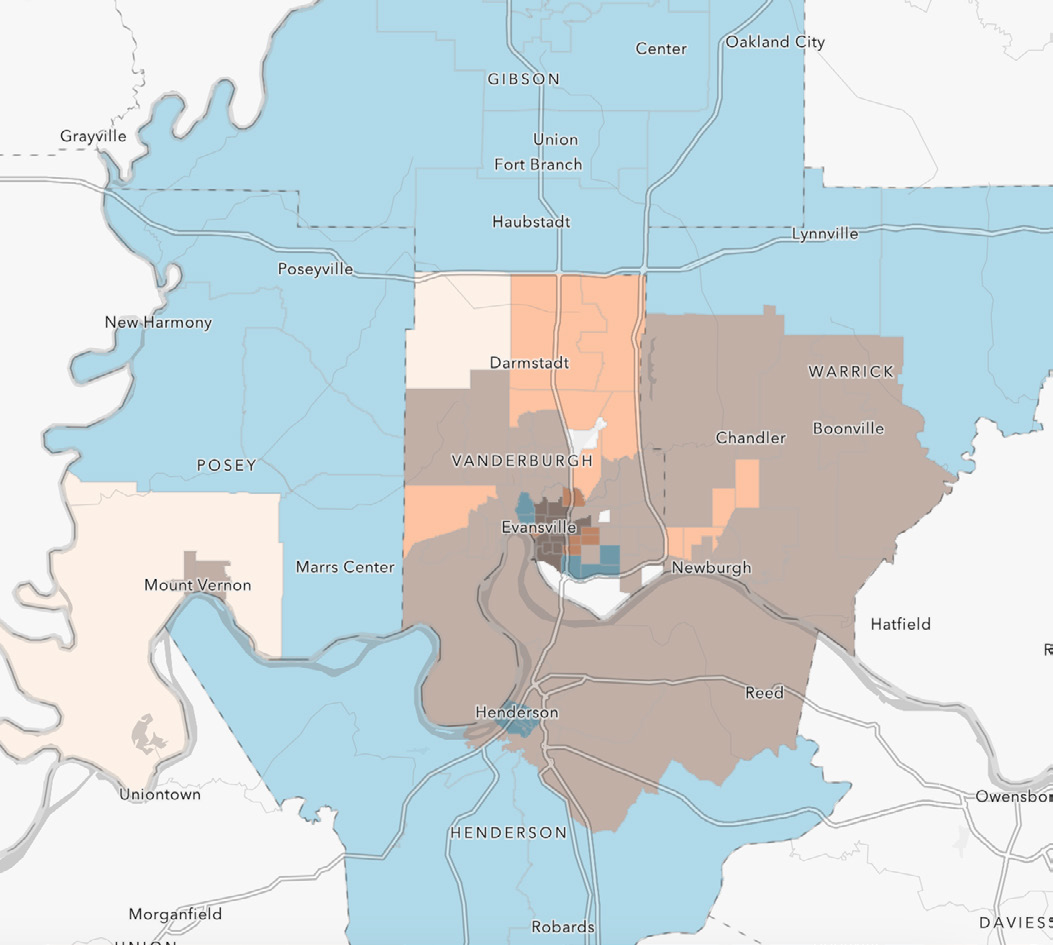
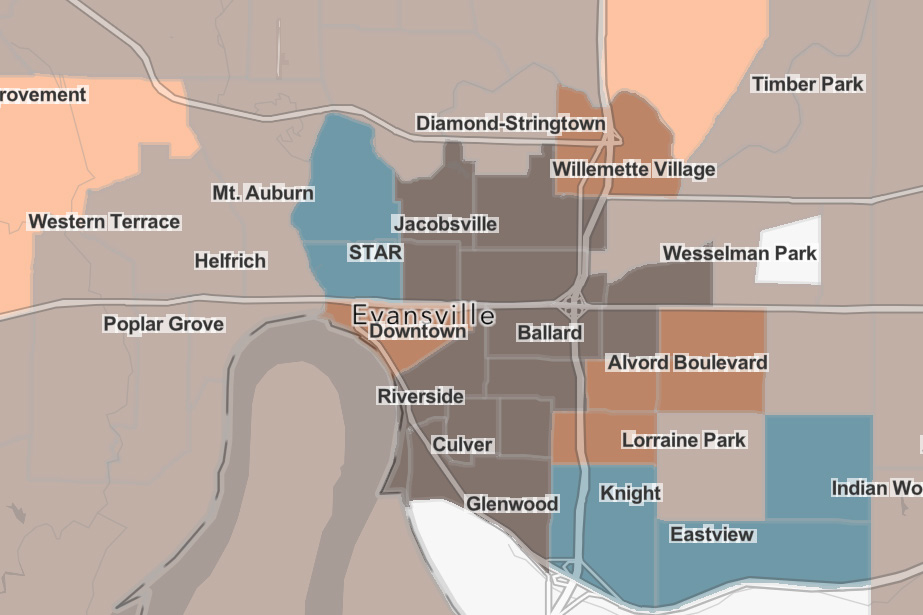
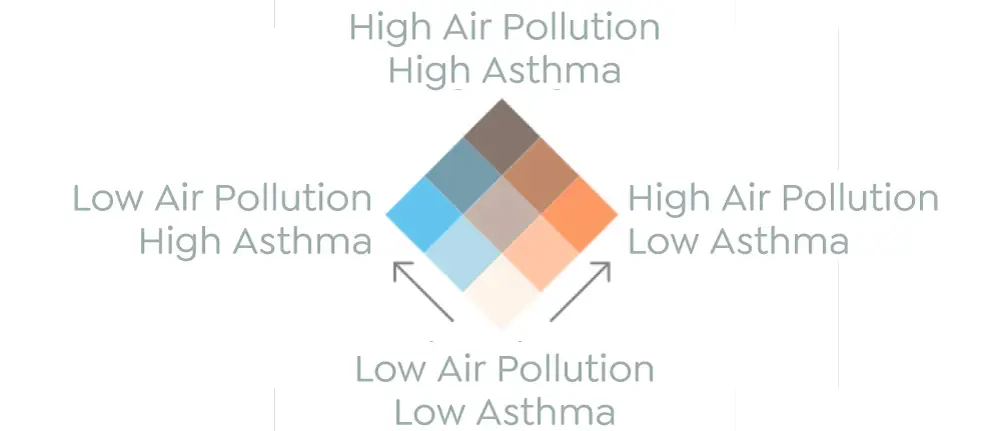
This map (right) identifies areas (colored brown) that have high rates of asthma and high levels of pollution. In the high asthma areas, an estimated 12% of adults have asthma. The average in the region is 10.9%. Areas with high air pollution levels score worse than 79% of the nation. The average in the area is 70%.
There area 21 tracts with high asthma rates (at least 12%). These areas are home to 50,000 residents. About half have high levels of air pollution (top 20% in the nation) and the others fall into the top 30% in the nation. There are no census tracts where asthma rates are high but air pollution is low.
See Superfood Site, Soil Contamination cleanup project for Jacobsville and 12 other neighborhoods. A 4.5 square mile area of residentials soils contaminated by lead and arsenic.
Most areas with high asthma rates also have high levels of air pollution
Identifying census tracts with high asthma rates and air pollution levels (+1 standard deviation)
Notes
Monica Wang, “Higher walkability associated with increased physical activity and reduced obesity among United States adults,” Obesity 31, no. 2 (2023): 553-564, https://onlinelibrary. wiley.com/doi/10.1002/oby.23634.
Stephanie Orstad, “Park Proximity and Use for Physical Activity among Urban Residents: Associations with Mental Health,” International Journal of Environmental Research and Public Health 17, no. 3 (2020), https://www.mdpi.com/1660- 4601/17/13/4885.
Hong-Bae Kim, “Long-Term Exposure to Air Pollutants and Cancer Mortality: A Meta-Analysis of Cohort Studies,” International Journal of Environmental Research and Public Health 15, no. 11 (2018), https://www.mdpi.com/1660- 4601/15/11/2608.
Haneen Khreis, “Exposure to traffic-related air pollution and risk of development of childhood asthma: A systematic review and meta-analysis,” Environment International 100 (2017), https://www.sciencedirect.com/science/article/abs/pii/S0160412016307838.
Indiana Dept. of Environmental Management, “Section 303(d) List of Impaired Waters,” 2024. https://www.in.gov/idem/nps/ watershed-assessment/water-quality-assessments-andreporting/ section-303d-list-of-impaired-waters/
Superfund Soil Contamination cleanup project for Jacobsville https://cumulis.epa.gov/supercpad/SiteProfiles/index.cfm? fuseaction=second.cleanup&id=0508142